In today’s world, data has become a crucial aspect of businesses. It is used to make informed decisions, develop effective strategies, and streamline operations. Business intelligence (BI) tools have been developed to help businesses access and analyze data efficiently.
These tools have become increasingly popular in recent years, and it is important to stay updated with the latest ones to stay ahead of the competition. Here are the top 5 business intelligence tools that you need in 2023.
1. Power BI

Power BI is a powerful and user-friendly data visualization tool developed by Microsoft. It allows users to connect to a wide range of data sources, including Excel spreadsheets, databases, and cloud-based services like Salesforce and Google Analytics.
Power BI has a drag-and-drop interface that makes it easy to create interactive reports and dashboards without the need for technical skills. It also has a natural language query feature that allows users to ask questions in plain English, and the tool will automatically generate the answer.
Key Features of Power BI:
- Data Visualization
- Data Exploration
- Data Modeling
- Dashboards and Reports
- Cloud-based Collaboration
- AI-powered Insights
- Integration with Microsoft products
2. Tableau

Tableau is another popular data visualization tool that allows businesses to transform their data into interactive visualizations and dashboards. It has a user-friendly interface that makes it easy for non-technical users to create powerful visualizations.
Tableau can connect to a wide range of data sources, including Excel spreadsheets, databases, and cloud-based services like Amazon Redshift and Google BigQuery. It also has a feature called Tableau Prep, which allows users to clean and transform their data before visualizing it.
Key Features of Tableau:
- Data Visualization
- Data Exploration
- Data Modeling
- Dashboards and Reports
- Data Preparation
- Integration with a wide range of data sources
- Collaboration and Sharing
3. QlikView

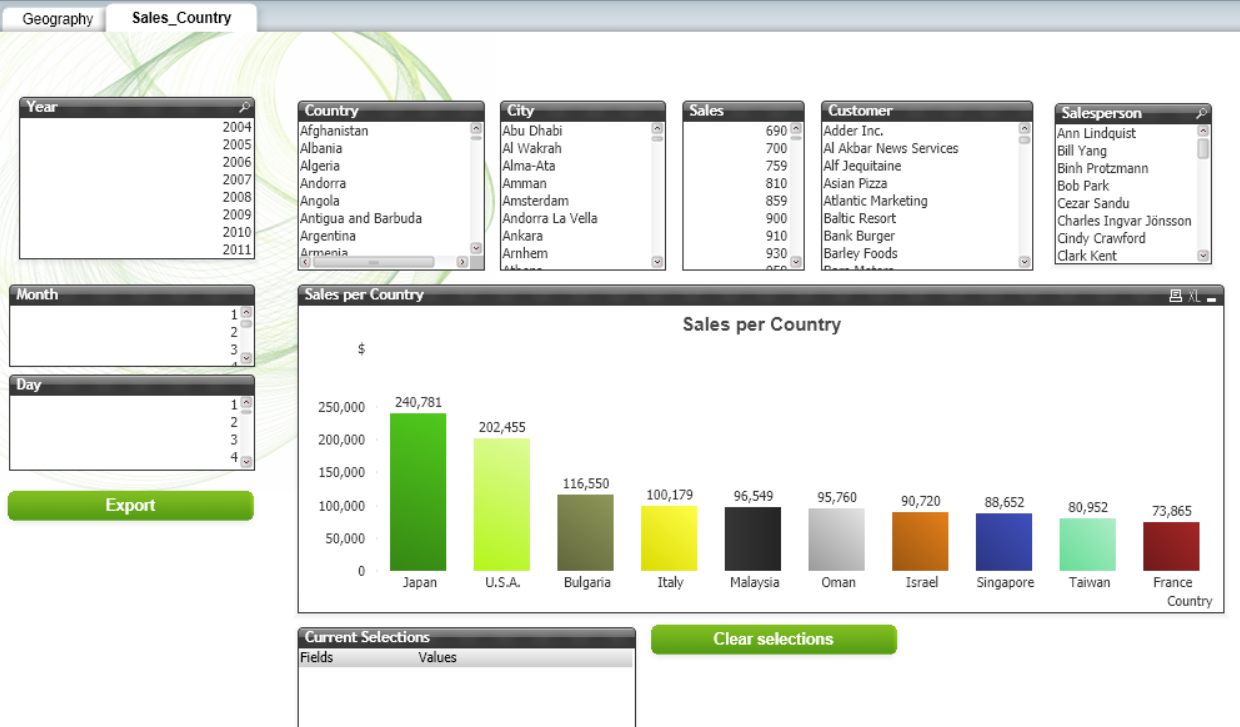
QlikView is a self-service business intelligence tool that allows users to explore data and create their own dashboards and reports. It has a patented in-memory data retrieval engine that makes it faster than traditional BI tools.
QlikView can connect to a wide range of data sources, including Excel spreadsheets, databases, and cloud-based services like Amazon Redshift and Google BigQuery. It also has a feature called Qlik Sense, which allows users to create custom visualizations using drag-and-drop tools.
Key Features of QlikView:
- In-memory Data Retrieval
- Self-Service BI
- Data Exploration
- Dashboards and Reports
- Collaboration and Sharing
- Integration with a wide range of data sources
- Custom Visualizations
4. SAP BusinessObjects

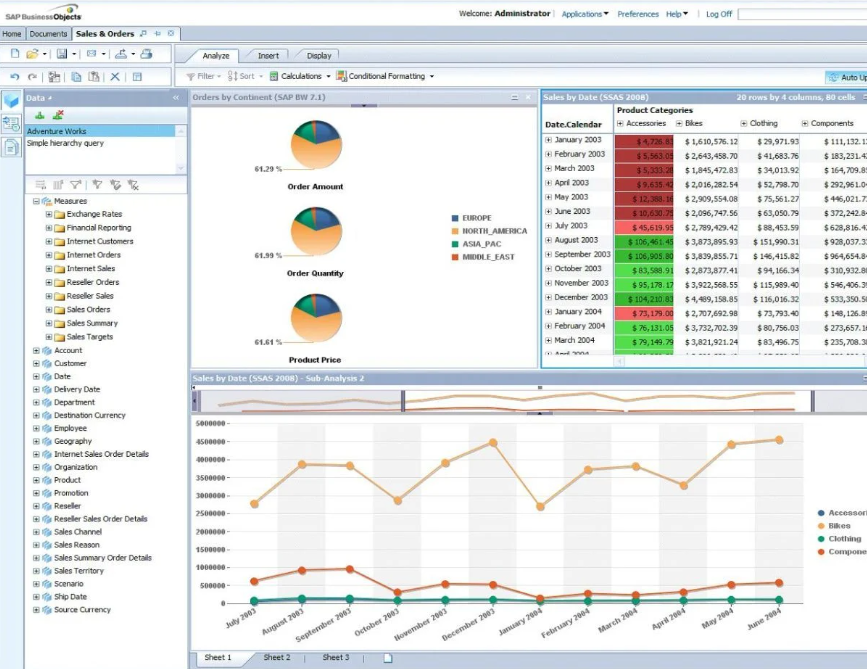
SAP BusinessObjects is a suite of business intelligence tools that allows users to access, analyze, and share data across their organization. It has a wide range of tools, including Crystal Reports, Web Intelligence, and Dashboards.
SAP BusinessObjects can connect to a wide range of data sources, including SAP and non-SAP systems. It also has a feature called Lumira, which allows users to create custom visualizations and share them with others.
Key Features of SAP BusinessObjects:
- Suite of Business Intelligence Tools
- Data Exploration
- Dashboards and Reports
- Collaboration and Sharing
- Integration with SAP and non-SAP systems
- Custom Visualizations
5. Looker

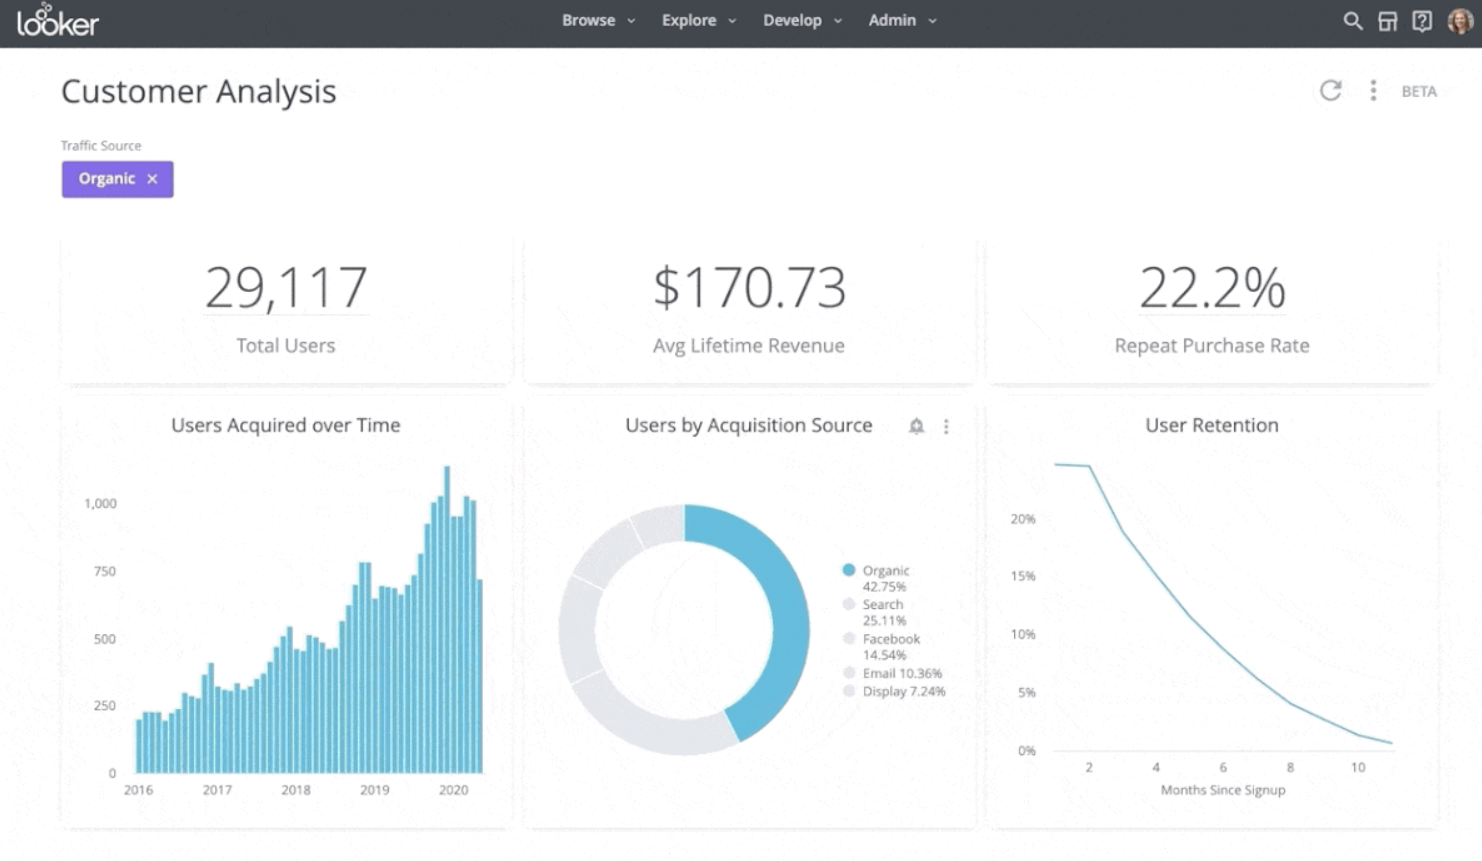
Looker is a cloud-based business intelligence tool that allows users to explore and analyze data. It has a unique modeling language called LookML, which allows users to define their data models and transform their data. Looker can connect to a wide range of data sources, including
Key Features of Looker:
- Cloud-Based BI Tool
- LookML Modeling Language
- Data Exploration
- Dashboards and Reports
- Collaboration and Sharing
- Integration with a wide range of data sources
- Custom Visualizations
In summary, these are the top 5 business intelligence tools that you need in 2023 to help you access, analyze and visualize your data effectively. Power BI and Tableau are great for data visualization, while QlikView and SAP BusinessObjects are more geared towards self-service BI and data exploration. Looker, on the other hand, provides a unique modeling language and is a great option for cloud-based data exploration.
It’s important to note that each of these tools has its own strengths and weaknesses, so it’s essential to choose the right one based on your specific business needs. With the help of these tools, you can gain insights from your data, make informed decisions, and ultimately achieve your business objectives.
Conclusion
In conclusion, the importance of data in business cannot be overstated. To stay ahead of the competition, you need to have the right tools to access, analyze, and visualize your data. The five BI tools we have discussed in this article can help you achieve just that. With their user-friendly interfaces, powerful features, and integration capabilities, you can streamline your operations, make informed decisions, and ultimately grow your business.
FAQs
- What is Business Intelligence (BI)? Business Intelligence (BI) refers to the technologies and strategies used by businesses to collect, analyze, and visualize data.
- What are some benefits of using BI tools? BI tools can help businesses gain insights from their data, make informed decisions, identify trends and patterns, and ultimately improve their operations.
- Are these BI tools suitable for small businesses? Yes, these BI tools can be used by businesses of all sizes. Most of them offer different pricing plans, and some even have free versions with limited features.
- Can I use these BI tools with my existing systems? Yes, most of these BI tools can connect to a wide range of data sources, including popular databases and cloud-based services.
- Do I need technical skills to use these BI tools? While some BI tools require technical skills, most of the tools we have discussed in this article have user-friendly interfaces that make it easy for non-technical users to create powerful visualizations and reports.